How to Trade the Stochastic with Success Part 2
Interesting replays relevant with Currency Trading Systems, Forex Ambush Review, and How To Trade Stochastic, How to Trade the Stochastic with Success Part 2.
Welcome back to our trading video series. How to trade stochastic is what we are covering today. In this lesson we are exploring how to trade the stochastic oscillator for active day traders and longer term investing using technical analysis in the stock market, forex market. and futures market. http://news.gmtfutures.com/
Today’s lesson we will explore a momentum oscillator called the Stochastic.
There are three 3 different types of stochastic oscillators:
1. The fast;
2. Slow; and
3. The full stochastic.
The most common of the three used by traders is the slow stochastic which is what we will focus on in today’s lesson.
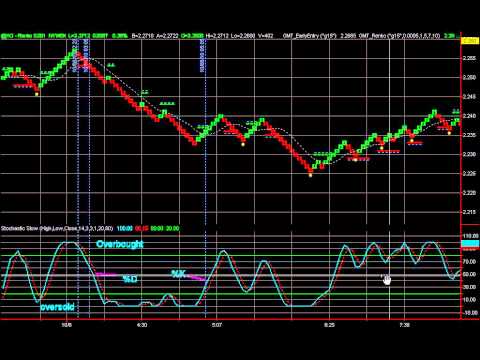
The Stochastic Oscillator contains two lines which are plotted below the price chart and are known as the %K and %D lines. The Stochastic is a banded oscillator so the %K and %D lines fluctuate between zero and 100, and has lines plotted at 20 and 80 which represent the high and low ends of the range.
As prices trend and close in the upper end of their trading range of a financial instrument you are analyzing, this is a reflection that momentum of the trend is strong and vice versa for a downtrend. The other two lines that are
Example of a Stochastic Oscillator:
Most if not all charting packages will calculate the lines for you automatically but you should know that the data points which form the %K line are basically a representation of where the market has closed for each period in relation to the trading range for the 14 periods used in the indicator. In simple terms it is a measure of momentum in the market.
The %D line is very simply a 5 period simple moving average of the %K line.
The stochastic oscillator can be used to identify overbought and oversold levels in the market. When the lines that make up the indicator are above 80 this reflects a market that is potentially overbought and when they are below 20 this reflects a market that is potentially oversold.
Better success may be achieved by waiting for the %K line to trade back below or above the 80 or 20 line as this gives a better signal that the momentum in the market is reversing according to the indicators developer by George Lane.
The second way that traders use this indicator to generate signals is by watching for a crossover of the %K line and the %D line. When the faster %K line crosses the slower %D line this is a sign that the market may be heading up and when the %K line crosses below the %D line this is a sign that the market may be heading down.
Finally, the third approach used by traders is to watch for divergences where the Stochastic trends in the opposite direction of price. This is an indication that the momentum in the market is potentially and a reversal may ensue. Traders will often wait for the cross below the 80 or above the 20 line before entering a trade on divergence for additional confirmation.
We can give you capital to trade check out the information below.
http://news.gmtfutures.com/
That concludes our look at the Stochastic. Have a great day!
Team GMT Futures & FX
p: +61 7 3360 0875 | e: info@gmtfutures.com w: http://www.gmtfutures.com
Level 19, Waterfront Place, 1 Eagle Street, Brisbane, QLD, Australia, 4000
Trading involves the risk of loss as well as the potential for profit. Please be advised that any advice provided by Key Equity Education Pty Ltd including this video on your trading is general financial product advice only, and your personal financial circumstances have not been considered in its preparation. Please consult your licensed financial consultant to decide if trading in Securities, Derivatives, & Foreign Exchange is suitable for your personal financial situation
How To Trade Stochastic, How to Trade the Stochastic with Success Part 2.
Daily Charts Method That Pulls 100-500+ Pips Per Trade
It is the most traded market worldwide with about $3 trillion being traded every day. It is one of the easiest tools used in TA. Also trade on the duration where major markets are open.
How to Trade the Stochastic with Success Part 2, Get more complete videos about How To Trade Stochastic.
Range Trading Secrets
And if this is the circumstance, you will not be able to presume that the cost will turn again. Path your block slowly and beyond typical volatility, so you don’t get bumped out of the trend to soon.

Here we are going to take a look at how to utilize forex charts with a live example in the markets and how you can use them to discover high odds possibility trades and the opportunity we are going to take a look at remains in dollar yen.
You require to have the state of mind that if the break happens you Stochastic Trading choose it. Sure, you have actually missed out on the very first little bit of earnings but history reveals there is generally plenty more to follow.
Them major problem for the majority of traders who use forex technical analysis or forex charts is they have no understanding of how to deal with volatility from a entry, or stop perspective.
Resistance is the location of the chart where the rate stops increasing. No brand-new highs have been fulfilled in the last few Stochastic Trading sessions and the cost remains in a sideways instructions.
Some of the stock signals traders take a look at are: volume, moving averages, MACD, and the Stochastic Trading. They likewise ought to look for floorings and ceilings in a stock chart. This can reveal a trader about where to get in and about where to go out. I say “about” due to the fact that it is pretty difficult to think an “specific” bottom or an “precise” top. That is why securing earnings is so so vital. , if you don’t lock in profits you are actually running the danger of making an useless trade.. Some traders become truly greedy and it just injures them.
Breakouts to brand-new market highs or lows and this is the methodology, we desire to utilize and it will constantly work as the majority of traders can not buy or offer breakouts. Most traders have the concept they want to buy low sell high, so when a break occurs they desire to get in at a much better cost on a pullback but obviously, on the huge breaks the cost does NOT pullback and the trader is left believing what might have been.
Keep in mind, if your trading stocks, do your research and go in with a plan and stick to it. Do not forget to secure earnings. Stock trading can make you a great deal of money if performed in a disciplined way. So get out there and attempt it out.
In an uptrend each brand-new peak that is formed is greater than the previous ones. The Stochastic – is a really powerful trade indicator. His work and research study are first class and parallel his character as a person.
If you are looking more entertaining reviews related to How To Trade Stochastic, and Stock Market Trend, Currency Swing Trading dont forget to join for email list now.
Related Posts

Crude Oil WTI News & Natural Gas Price Live Today 12 June | Live Market Analysis #crudeoil #gas

How to Identify High Probability Trades Using Divergence
